


Amazon Elastic Kubernetes Service (Amazon EKS) is a managed service that allows us to run Kubernetes Cluster on AWS without installing, operating, or maintaining our own control plane or nodes. Amazon Elastic Kubernetes Service is one of the most widely used services on AWS. The Kubernetes is an open source tool that can automatically deploy, manage and scale the containerized applications. AWS offers a variety of services such as EC2, S3, Fargate, EKS etc. A Kubernetes Dashboard provides an overview of the EKS Cluster’s applications using a web-based interface.
The Dashboard is a web-based user interface that allows us to deploy containers, manage the cluster resources and troubleshoot the containerized application. It allows us to view the status of our Kubernetes cluster, as well as create and modify individual Kubernetes resources (such as Pods, Nodes, Deployment, Jobs, etc.)
Read Also: How to Create Linux EC2 instance in AWS
In today’s tutorial, we will learn how to deploy the official Kubernetes Dashboard on an Amazon EKS with easy and simple steps.
Prerequisite
- Linux based Server (such as Ubuntu 22.04).
- Fully Qualified Domain Name
- Up and Running Elastic Kubernetes Service (EKS).
- AWS CLI must be configured with proper credentials.
- Kubectl command must be installed.
Set up your environment
- List the AWS Kubernetes Clusters.
aws eks list-clusters
- Update the kubeconfig file to connect the Kubernetes Cluster.
aws eks update-kubeconfig --name Kubernetes_Cluster_Name
- To verify that the Kubernetes Cluster is connected, run the following command.
kubectl get svc
- Now deploy the Metrics server on the EKS Cluster. Kubernetes Metrics Server does not integrate with Amazon EKS by default. This is why we need to install the Metrics server in the Kubernetes cluster. It is a reliable and scalable data source for the autoscaling pipeline. Run the following command to deploy the Metrics server on the EKS Cluster.
kubectl apply -f https://github.com/kubernetes-sigs/metrics-server/releases/latest/download/components.yaml
- Verify the Metrics server deployment.
kubectl get deployment metrics-server -n kube-system
Deploy the Kubernetes Dashboard
- Before deploying, we need to create a Namespace for the Dashboard. To create the Namespace run the following command.
kubectl create namespace kubernetes-dashboard
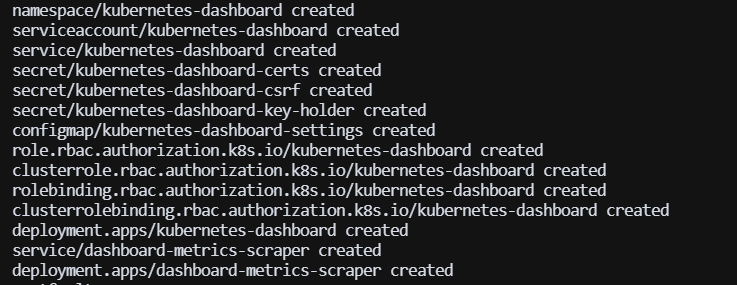
- Now deploy the Dashboard on the Kubernetes Cluster with the following command.
kubectl apply -f https://raw.githubusercontent.com/kubernetes/dashboard/v2.7.0/aio/deploy/recommended.yaml
Setup the Kubernetes Dashboard
- The Dashboard service is deployed to our private Kubernetes Cluster, So we need to use kube-proxy command to proxy our requests to access the Dashboard service. Run the following command in screen to proxy the request.
kubectl proxy -p 8001 --accept-hosts='^*$'
The above command will open port 8001 on the server, To access the Dashboard, the above command must be running in the background.
- To access the Kubernetes Dashboard, we need to setup a proxy pass to access the above specified port. We will use Nginx Web server to setup the proxy pass. Run the following command to install the Nginx on the server.
Ubuntu
sudo apt install nginx certbot python3-certbot-nginx jq -y
CentOS
sudo yum install nginx certbot-nginx jq -y
- Create a Nginx Virtual Host configuration for the Domain.
server {
        listen 80 default_server;
        listen [::]:80 default_server;

        server_name example.com www.example.com;

        location / {
                proxy_pass http://127.0.0.1:8001/;
        }
}
- Now check the Nginx configuration syntax and restart the Nginx service.
nginx -t
sudo systemctl restart nginx
- Implement the SSL certificate on the Domain with the following command.
sudo certbot --nginx -d example.com -d www.example.com
Note:- SSL is very important for the Dashboard. It will encrypt the traffic. Without SSL, Dashboard may not work properly.
Access the Kubernetes Dashboard
- To access your Dashboard, Copy and Paste the below URL on the browser with your domain.
https://example.com/api/v1/namespaces/kubernetes-dashboard/services/https:kubernetes-dashboard:/proxy/
- You will see a Dashboard like this after accessing the above URL.
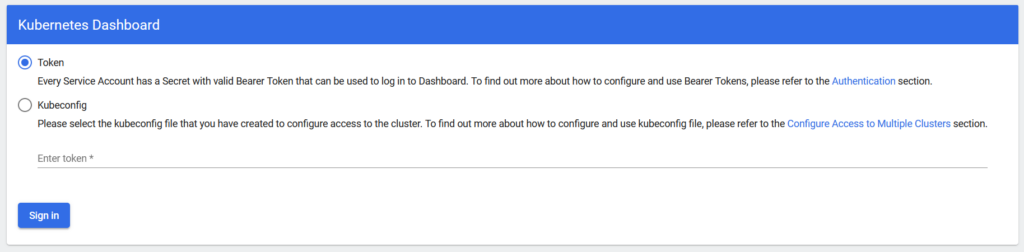
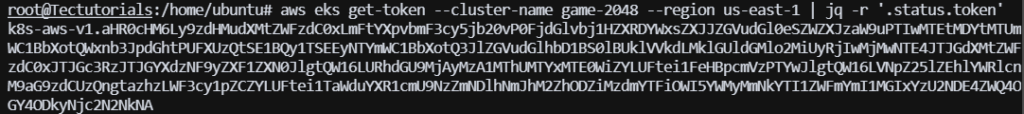
- Now we will use Token method to authenticate the Dashboard. To generate the Token, run the following command.
aws eks get-token --cluster-name CLUSTER_NAME --region AWS_REGION | jq -r '.status.token'
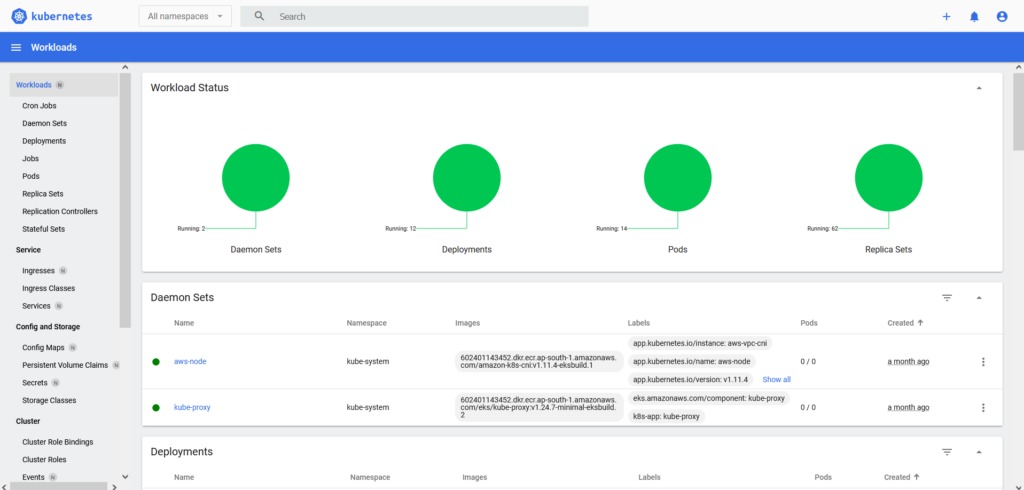
- Copy and Paste token on the Kubernetes Dashboard and then Click on the Sign in button.
- Now have landed on the Homepage of the Kubernetes Dashboard.
Conclusion
The Kubernetes Dashboard is indeed useful and easy to use, making it possible to perform daily tasks with it. The Kubernetes dashboard makes it easy to accomplish DevOps tasks through the UI. It is a good option for beginners as well as those who are not familiar with Kubernetes commands because it offers more data.
In today’s tutorial, we have learned to deploy the Kubernetes Dashboard on the Amazon EKS with a few simple and easy steps.
If you guys have any queries or questions, then let me know in the comments sections.